Energy deals, explained
From the terms you set.
To the value you can explain.
Explore how TrustyGenius connects a PPA, battery, gas storage facility or power plant to its cash flows and price exposure. Structure with Genius or use the ticket controls, then inspect the assumptions and compare scenarios.
Platform introduction + four 80-second explainers · Narrated and captioned
Start here
Energy workflows. A wider platform.
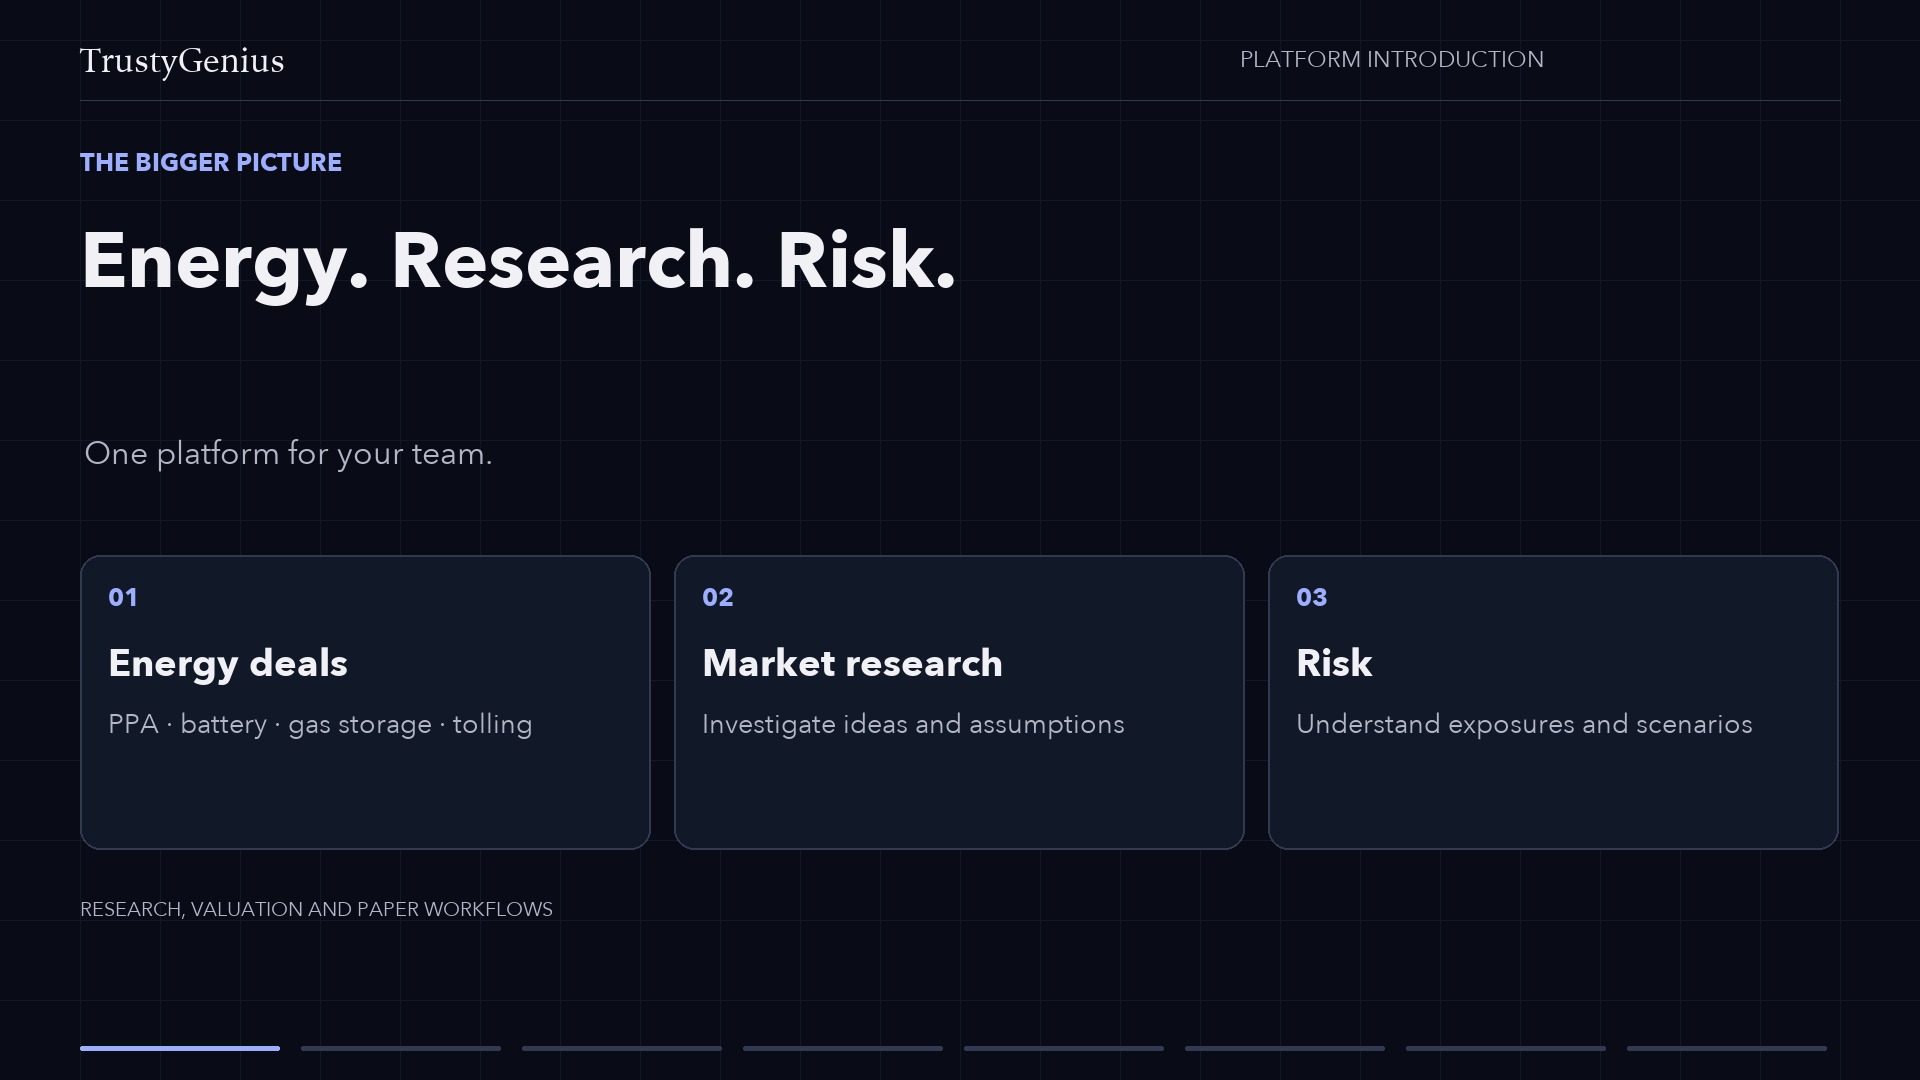
A short orientation to the markets, data and deployment behind these demos.
Read the introduction captions (text)Why you may see equities
Equities offer familiar examples of research, strategy and risk workflows. The platform also serves energy and commodity markets; the instrument on screen is an example of the workflow.
Futures options and your data
Options Strategist supports futures options with the required contract definitions and option data. Bring your own licensed market data. Vendor adapters provide the integration path; CME, ICE and other feeds require entitlements, mapping and configuration, with adapter development where needed.
Your team, your administration
Multiple users have private work areas, with permissions governing shared resources. Your administrator manages the platform and user access.
Run it on your hardware
In a customer-hosted deployment, the platform runs on your hardware. We access your installation only with your authorisation. Market data and AI services follow the external connections you configure; customer hosting does not automatically bring those services on premises.
Power purchase agreements
1:20
Edited product details and labeled illustrations. Synthetic demo prices; no transactions booked.
Read the captions (text)Connect the contract terms to delivery hours, cash flows, and location risk.
What to look for
Open a note for context as you watch. Times refer to the video.
0:06Start with the deal you mean.
MW is the power rate. The schedule determines how many hours carry that rate.
0:16See what makes up the value.
Present value brings modeled future cash flows into today’s money.
0:28Follow the cash flows through time.
Monthly energy and REC amounts can differ. Review the timing as well as the total.
0:40Make price uncertainty explicit.
Uncertainty assumptions affect supported price clauses. A forward-price view alone is intrinsic.
0:52Separate the hub from the node.
Hub and node can have different prices. The selected terms decide how those differences matter.
1:04Structure with Genius. Review the result.
The result is a model under stated assumptions. Demo scenarios remain unbooked.
Battery storage
1:20
Edited product details and labeled illustrations. Synthetic demo prices; no transactions booked.
Read the captions (text)Understand the battery’s size, dispatch, and valuation without confusing capacity with energy delivered.
What to look for
Open a note for context as you watch. Times refer to the video.
0:06Define the battery in the right units.
50 MW is a power rate. 100 MWh is energy capacity: a nominal two-hour duration.
0:16See energy moving in both directions.
Charging and discharging are energy flows. Netting them would hide the activity of the battery.
0:28Capacity notional is not delivered energy.
Capacity notional is MW × delivery hours. It is not the MWh charged or discharged.
0:40Resize the asset. Reprice the case.
Both power and energy rise 20%. Nameplate duration stays the same in this comparison.
0:52Understand the result of the resize.
The par rate uses capacity notional. Here it stays about $0.79/MWh as the asset scales.
1:04Review the assumptions behind the shape.
This recording uses flat time-of-use price blocks. It does not demonstrate a live hourly forecast.
Gas storage
1:20
Edited product details and labeled illustrations. Synthetic demo prices; no transactions booked.
Read the captions (text)Follow facility terms into inventory, intrinsic value, and benchmark-versus-basis exposure.
What to look for
Open a note for context as you watch. Times refer to the video.
0:06Begin with the facility and its terms.
The facility supplies its tariff terms. The contract defines the selected capacity and operating limits.
0:16Read the inventory alongside the flows.
Bars show gas moving in or out. The line shows inventory remaining in the facility.
0:28Know what intrinsic value represents.
Intrinsic value uses the current forward curve. This example does not demonstrate extrinsic option value.
0:40Separate the two parts of the gas price.
Basis is the location price difference from the benchmark. The two exposures can move independently.
0:52See what remains after the hedge.
A NYMEX hedge targets benchmark exposure. Location basis remains; whole-lot sizing can leave a residual.
1:04Connect the operating plan to its risk.
Inventory explains when gas is held. Benchmark and basis attribution explain which prices affect the result.
Gas-fired tolling
1:20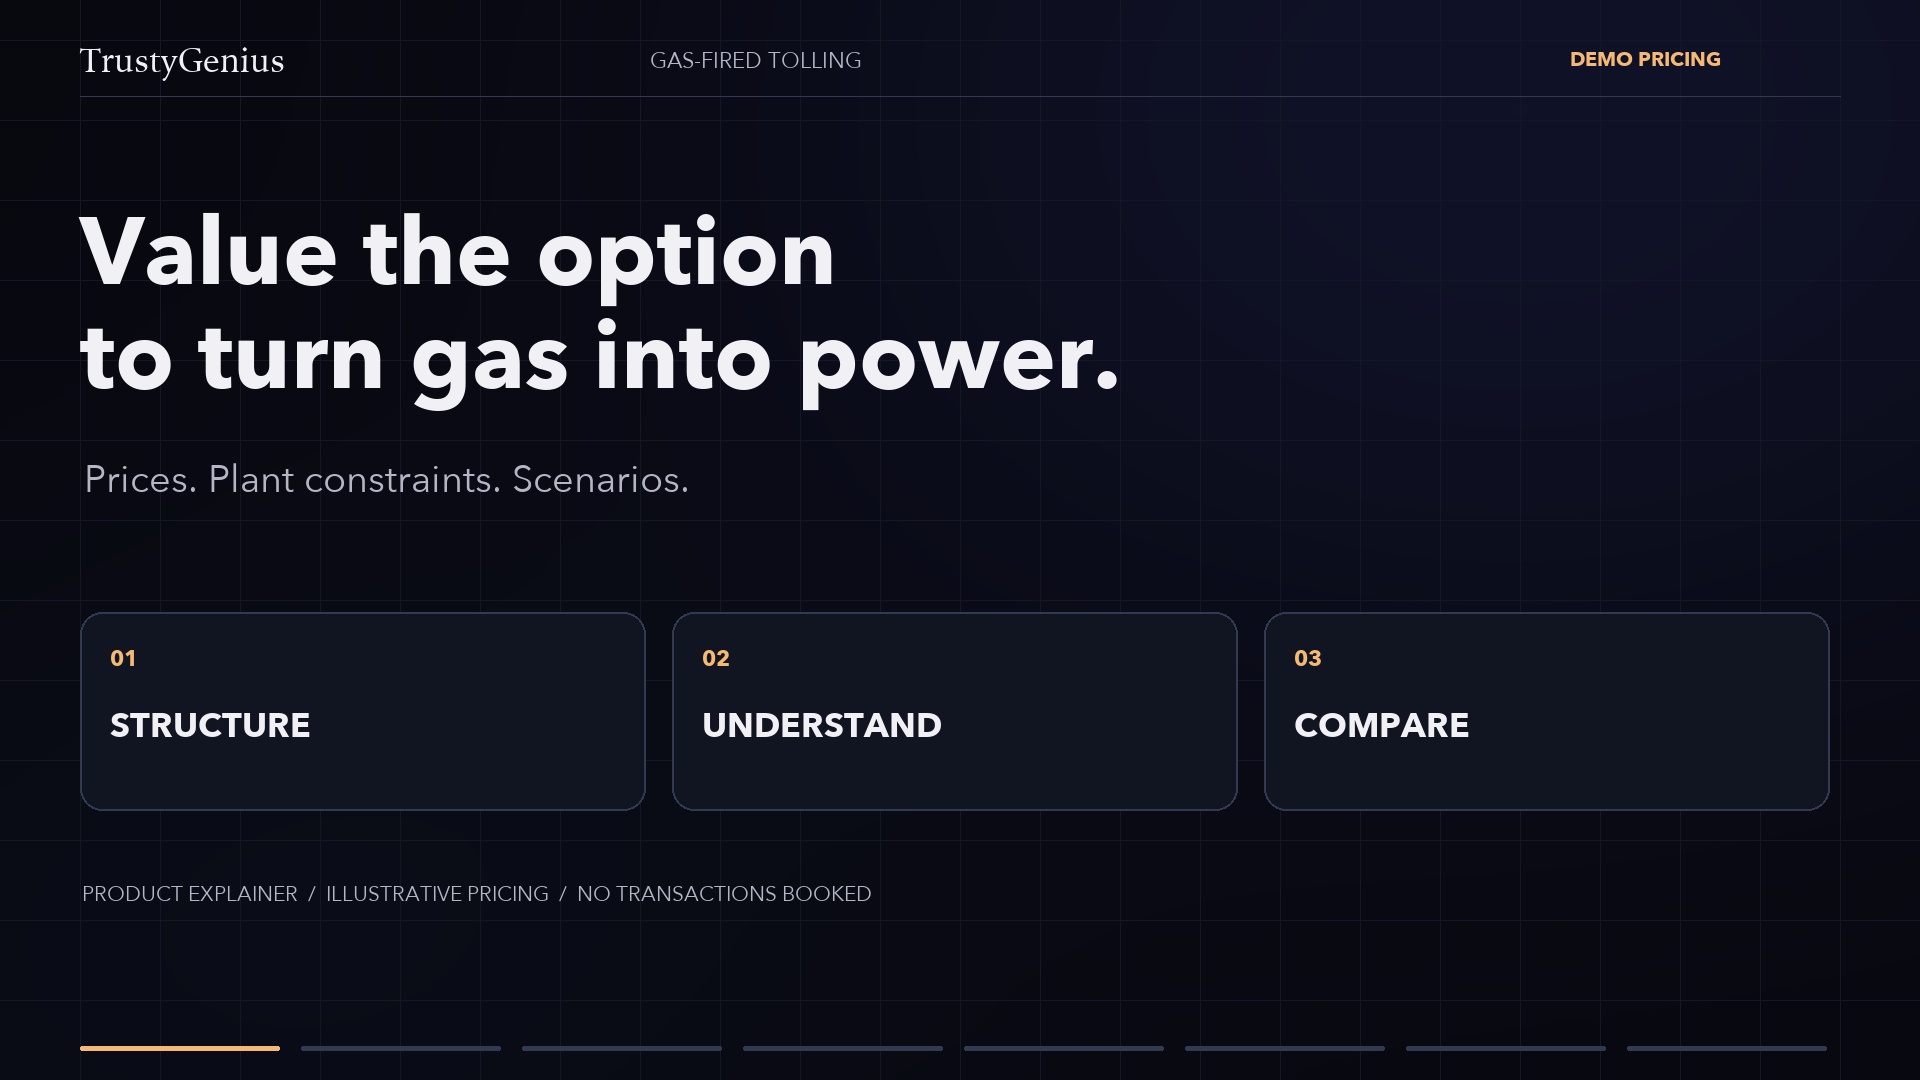
Edited product details and labeled illustrations. Synthetic demo prices; no transactions booked.
Read the captions (text)Connect power and gas prices to plant constraints, operating optionality, and scenario value.
What to look for
Open a note for context as you watch. Times refer to the video.
0:06Define the plant and the market pair.
Heat rate is fuel per unit of power output. At the stated running rate, 1 MWh uses 7 MMBtu.
0:16Start with the operating economics.
Operating economics depend on both market prices and plant constraints. A simple spread is only the starting point.
0:28Inspect the valuation under those terms.
This is the modeled contract value for the demonstrated scenario. It is not realized operating profit.
0:40Change capacity. Revalue the plant.
Maximum output changes; minimum output stays fixed. This is not a uniform rescaling of every plant constraint.
0:52Know which prices drive the result.
Valuation and price sensitivity answer different questions. Review exposure by market and delivery period.
1:04Structure the scenario. Review the evidence.
Keep the contract inputs, valuation, and available evidence together when comparing scenarios.
How to read these examples
Recorded results, conceptual illustrations and control previews are labeled in each film. The PPA control preview is separate from its recorded valuation. Battery dispatch uses synthetic time-of-use price blocks. The gas storage example shows intrinsic value; the tolling example shows scenario values without a dispatch path.
Go deeper · Access by request
Request the detailed recordings.
Follow the longer Genius conversations, deal inputs and valuation results. Contact us to arrange private viewing access. These links open an access request, not a public video.
Power purchase agreements
Connect the contract terms to delivery hours, cash flows, and location risk.
Request private accessBattery storage
Understand the battery’s size, dispatch, and valuation without confusing capacity with energy delivered.
Request private accessGas storage
Follow facility terms into inventory, intrinsic value, and benchmark-versus-basis exposure.
Request private accessGas-fired tolling
Connect power and gas prices to plant constraints, operating optionality, and scenario value.
Request private accessBring the deal you want to understand.
Walk through the terms, curves and assumptions with us.